
Assessment Tool for ATCS Evaluation
Welcome to the Assessment Tool for Adaptive Traffic Control – (AT)2C.
The (AT)2C has been designed to enable users to analyze both: under which conditions Adaptive Traffic Controls Systems (ATCS) are deployed and what benefits such deployments bring.
Users can perform these analyses by filtering through both basic and advanced main categories designated for each ATCS deployment/evaluation.
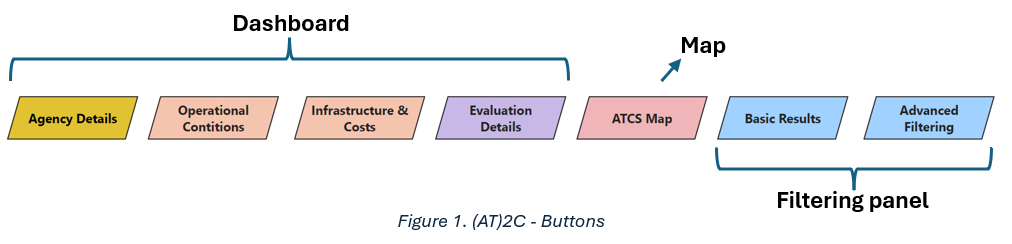
The (AT)2C has two main components: The (AT)2C - Dashboard and the (AT)2C - Filtering panel. The (AT)2C Dashboard serves as a tool for accessing fundamental details regarding ATCS deployments, including basic agency information, operational conditions, and infrastructure costs. Meanwhile, the (AT)2C Filtering panel enhances user experience by allowing for the complete evaluation results through detailed filters, thereby providing more comprehensive and tailored information.
In addition to these two (AT)2C components, this webpage also contains a Map of the ATCS deployment, which shows all known ATCS deployments in the Noth America. The map allows users to filter ATCS deployments by ATCS Brand and State of deployment, for more targeted searches and analysis.
Navigation through the (AT)2C tool is enabled through the buttons located on the right-side panel (see Figure 1) - e.g. by selecting a button user can access relevant (AT)2C page or functionality.
Each of the Dashboard Pages (e.g., Agencies & Installation, Deploying Environment, etc.) contains several visuals and filters. By selecting any of the offered filters a user can select to display relevant information, which is then automatically updated in the relevant charts and tables.
Each of the Filtering options contains several charts and numerous filters (depending on the type of filtering basic or advanced). By selecting relevant options and/or adjusting available slicers, a user can see ranges of ATCSs benefits (which are usually represented by mean values of relevant performance measures).
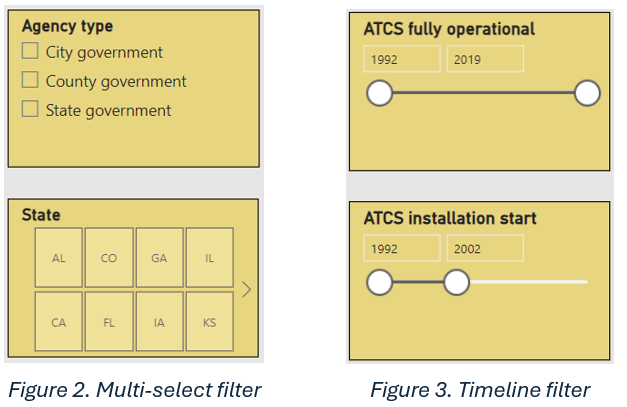
Multi-select filter - by checking one of the provided checkboxes (e.g., County government), a user decides to display only data about ATCSs deployed by County government (see Figure 2).
A marked checkbox on a filter indicates the current filtering state. Users can choose to check multiple boxes, by holding the Ctrl button on a keyboard.
Selecting Clear Filter ![]() will clear any of the existing selections and the filters will be restored to the initial stage.
will clear any of the existing selections and the filters will be restored to the initial stage.
Timeline filter (see Figure 3) - works in the same way as a Multi-select filter. It is used to filter out time periods (e.g., years) when particular event occurred (e.g., ATCSs were deployed/evaluated).
A dark line of the slicer indicates the current filtering state.
It is important to note that with each additional selection made, the number of available instances for further filtering decreases. Users may find beneficial to experiment with filtering options, e.g., clearing certain filters, to determine which filtering criterion has a greatest impact on the data entries. This type of analysis can help identify the most significant data options for refining search results.
The (AT)2C depends on a relatively robust dataset structure, whose search may be very time consuming. Some of the filtering processes may take several seconds before the corresponding updates are reflected in the charts and tables.
To access the Assessment Tool for ATCS click here.