


Spring 2026 Projects

FedEx operates one of the largest and most complex logistics networks in the world, requiring highly optimized routing decisions to ensure cost efficiency, service reliability, and effective resource utilization. At the core of this system is the Titan optimization model, which determines routing paths for trailer movements across the Linehaul network. While Titan performs well within its current framework, it relies heavily on historically derived candidate paths, limiting its ability to explore novel routing configurations and adapt to changing operational conditions. This reliance introduces a key tradeoff between maintaining computational efficiency and expanding the solution space to identify more optimal routing decisions.
This project addresses this limitation by developing a machine learning–based path generation methodology designed to enhance the diversity and quality of candidate routing paths provided to Titan. Rather than replacing the existing optimization model, the proposed approach focuses on improving the upstream generation of candidate paths. A transformer-based model was trained on historical Titan input-output data to learn the relationships between operational constraints and routing decisions. The model generates structured candidate paths that are compatible with Titan’s optimization framework while introducing new routing configurations that are not constrained by historical patterns.
To support this approach, a comprehensive data pipeline was developed to transform large-scale operational data into a structured format suitable for machine learning. The model was trained and evaluated using historical Titan runs, with performance assessed through both statistical and operational metrics, including cross-entropy loss, feasibility rates, and cost comparisons. Evaluation results demonstrate that the model is capable of generating highly diverse routing candidates, achieving complete novelty relative to historical paths and maintaining strong adherence to network connectivity constraints. Additionally, generated paths were found to be cost-competitive with existing solutions, with some instances outperforming baseline routes.
Despite these promising results, the model currently faces limitations in consistently satisfying all system-level constraints, particularly those related to timing and structural formatting. Feasibility rates remain below operational thresholds, indicating that further refinement is required before full integration into the Titan framework can be achieved. These findings highlight that while machine learning can effectively expand the candidate solution space, additional development is needed to improve constraint enforcement and ensure operational viability.
Based on these results, it is recommended that FedEx continue exploring machine learning–based approaches to path generation as a complementary tool to existing optimization methods. In the short term, improvements should focus on enhancing feature representation and incorporating constraint-aware mechanisms into the model. In the long term, continued advancements in machine learning and increased availability of training data may enable more robust and scalable implementations. Overall, this project demonstrates the feasibility and potential impact of data-driven path generation, providing a strong foundation for future innovation within FedEx’s Linehaul optimization processes.

Flexibility in a manufacturing facility is critical to a reliable and scalable operation. At Nord-Lock, the current assembly area offers an opportunity for improvement when it comes to labor flexibility and operational efficiency. For the semester, the Pitt Senior Design Team worked with the Nord-Lock team to improve this assembly area to increase throughput and decrease reliance on temporary labor. This problem is broadly broken into three phases.
First is the measure and analysis phase. This phase consists of defining and evaluating current state metrics of the system. Methods used in this phase include root cause analysis, value-stream mapping, and CRAFT analysis of the current layout. These methods are helpful in determining improvements that will be most critical to the goals of the operation.
Second, the improvement phase is about proposing possible solutions to the problems found during the analysis phase. Methods used during this phase include creating standard work, evaluating different layouts using CRAFT analysis, and creating a new labor calculator tool.
Finally, the control phase is about implementation of the proposed solution. This plan is specific and addresses concerns about implementation brought up by the Nord-Lock team. The improvements suggested will help Nord-Lock to run a more reliable and robust operation at a low cost, while also setting the framework for future continuous improvement initiatives.

This report presents the process of optimizing and redesigning the manual assembly layout for Parker Hannifin at their Irwin, PA, plant. The primary goal is to reduce the existing work areas as much as possible to accommodate expected new product acquisitions and increasing demands. The team aims to minimize the area utilized per cell greatly and centralize the new free space to make it usable.
The team utilized the DMAIC approach which began by defining the problem. Using the customer requirements, they created a problem statement that addressed the space reduction required. They worked with Parker to define what was in scope for the project and what they envisioned receiving upon completion of the project. Moving into the Measure phase, the team analyzed the current state layout using Gemba walks and creating spaghetti diagrams to determine product flow. This was followed by the Analyze phase, wherein the team created demand forecasts for the existing products and identified where waste was most prevalent on the production floor. To help visualize we created an employee utilization heat map to see which work cells might be best to combine, reduce, or take a closer look at. Next, in the Improve phase, the team concocted summaries of workstation reductions—whether that be benches or standing area, hypothesized work cell combinations, and worked towards eliminating the chosen waste. Finally, in the Control phase, the team worked on a proposed implementation plan and produced a cost analysis for Parker to ensure smooth transitions.
With the main findings, Parker will receive a summarized version of the team’s recommendations. Mainly explaining the cells to combine, relocation of equipment and cells, and removal of obsolete cells or equipment as well. In addition to this, the Deliverables include CAD models of all combination workbenches, work cell utilization heat maps, an interactive implementation schedule to keep track of progress, the cost analysis, the revised final layout Visio file, workbench reduction recommendation Pugh matrices and list of alternatives. This ensures that Parker can most effectively introduce any of our changes and continue to operate at current throughput levels.
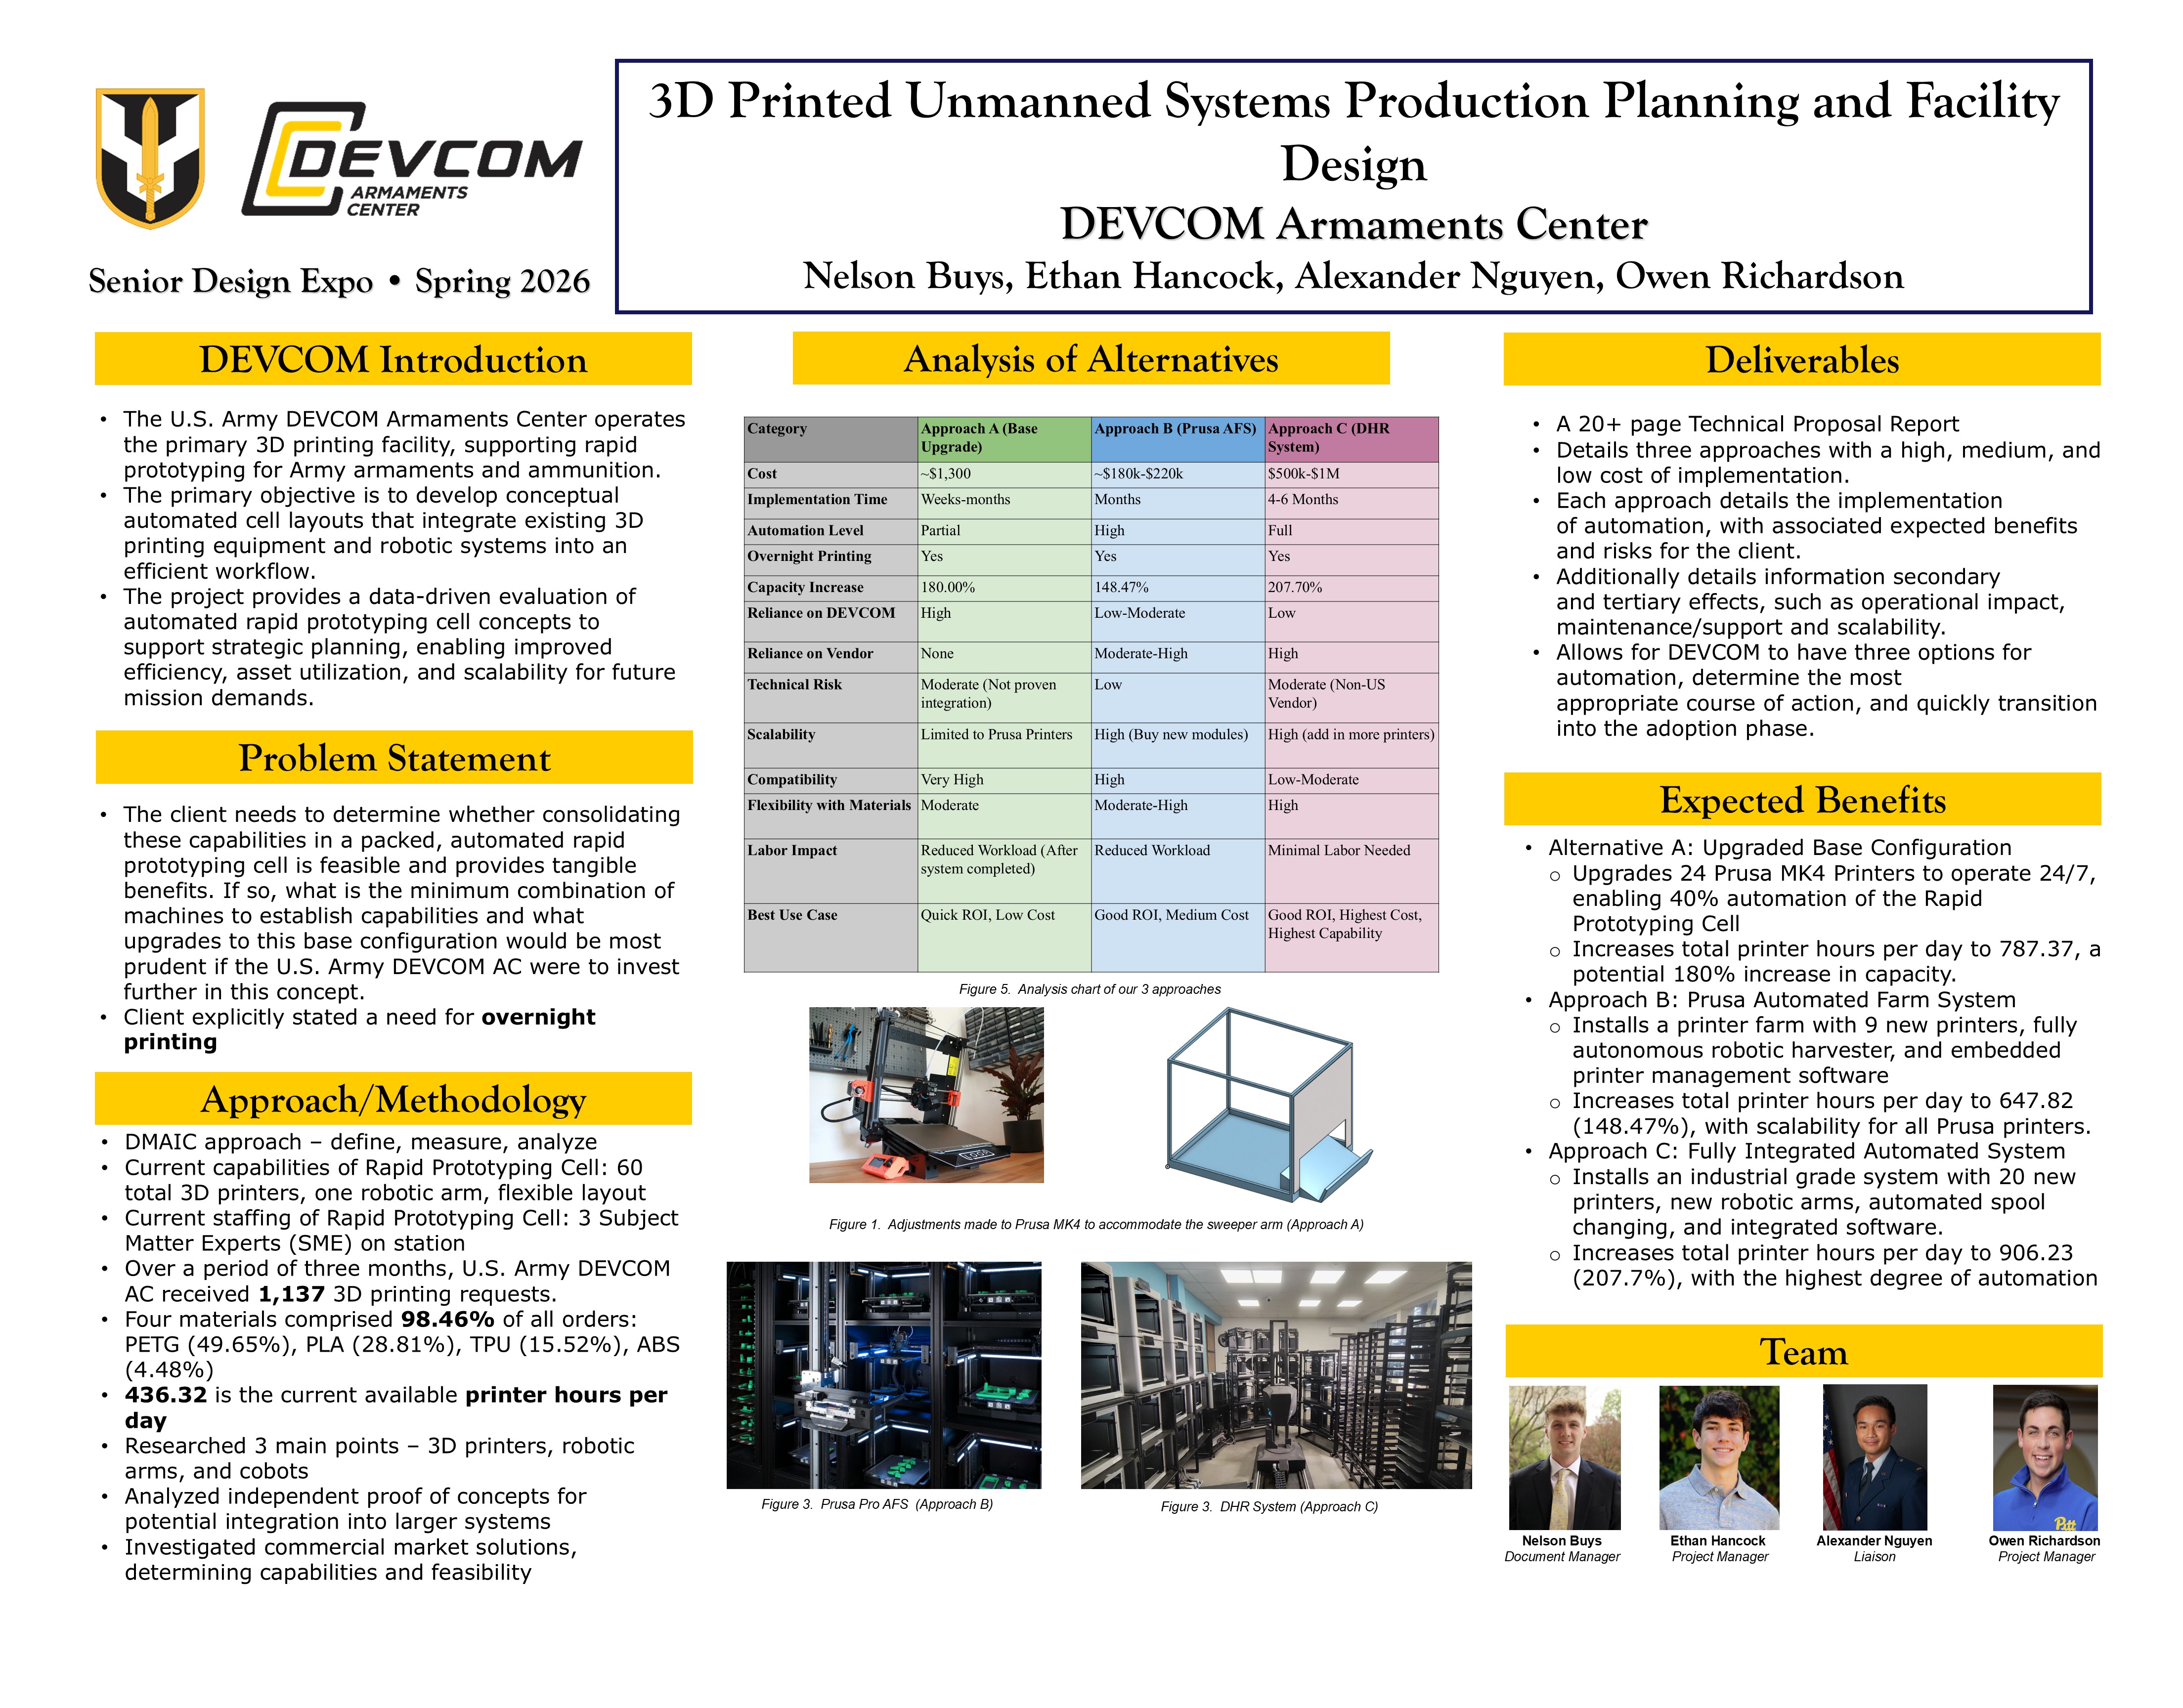
The U.S. Army DEVCOM Armaments Center operates the primary 3D printing facility at Picatinny Arsenal, supporting rapid prototyping for Army armaments and ammunition. A highly diverse workforce and dispersed layout create complex workflows, high variability, and limited standardization, which constrain efficiency and scalability. To address these challenges, DEVCOM is exploring the feasibility of consolidating additive manufacturing capabilities into a compact, automated rapid prototyping cell.
This project evaluates the feasibility and benefits of such consolidation and automation. The primary objective is to develop conceptual automated cell layouts that integrate existing 3D printing equipment and robotic systems into an efficient workflow. Quantitative analysis of current performance establishes a baseline for comparison, while multiple layout configurations are assessed to evaluate tradeoffs among efficiency, flexibility, cost, and automation potential.
The study emphasizes feasibility and strategic decision support. Background research in additive manufacturing, robotics, and automation informs workflow design and efficiency metrics, with particular focus on identifying non-automatable process steps, especially in post-processing, and their impact on system performance.
Key risks include limited availability of operational data, uncertainties in robotic integration, and post-processing material constraints. Mitigation strategies include conservative assumptions, expert consultation, and consideration of alternative processing methods.
Overall, this project provides a data-driven evaluation of automated rapid prototyping cell concepts to support strategic planning, enabling improved efficiency, asset utilization, and scalability for future mission demands.
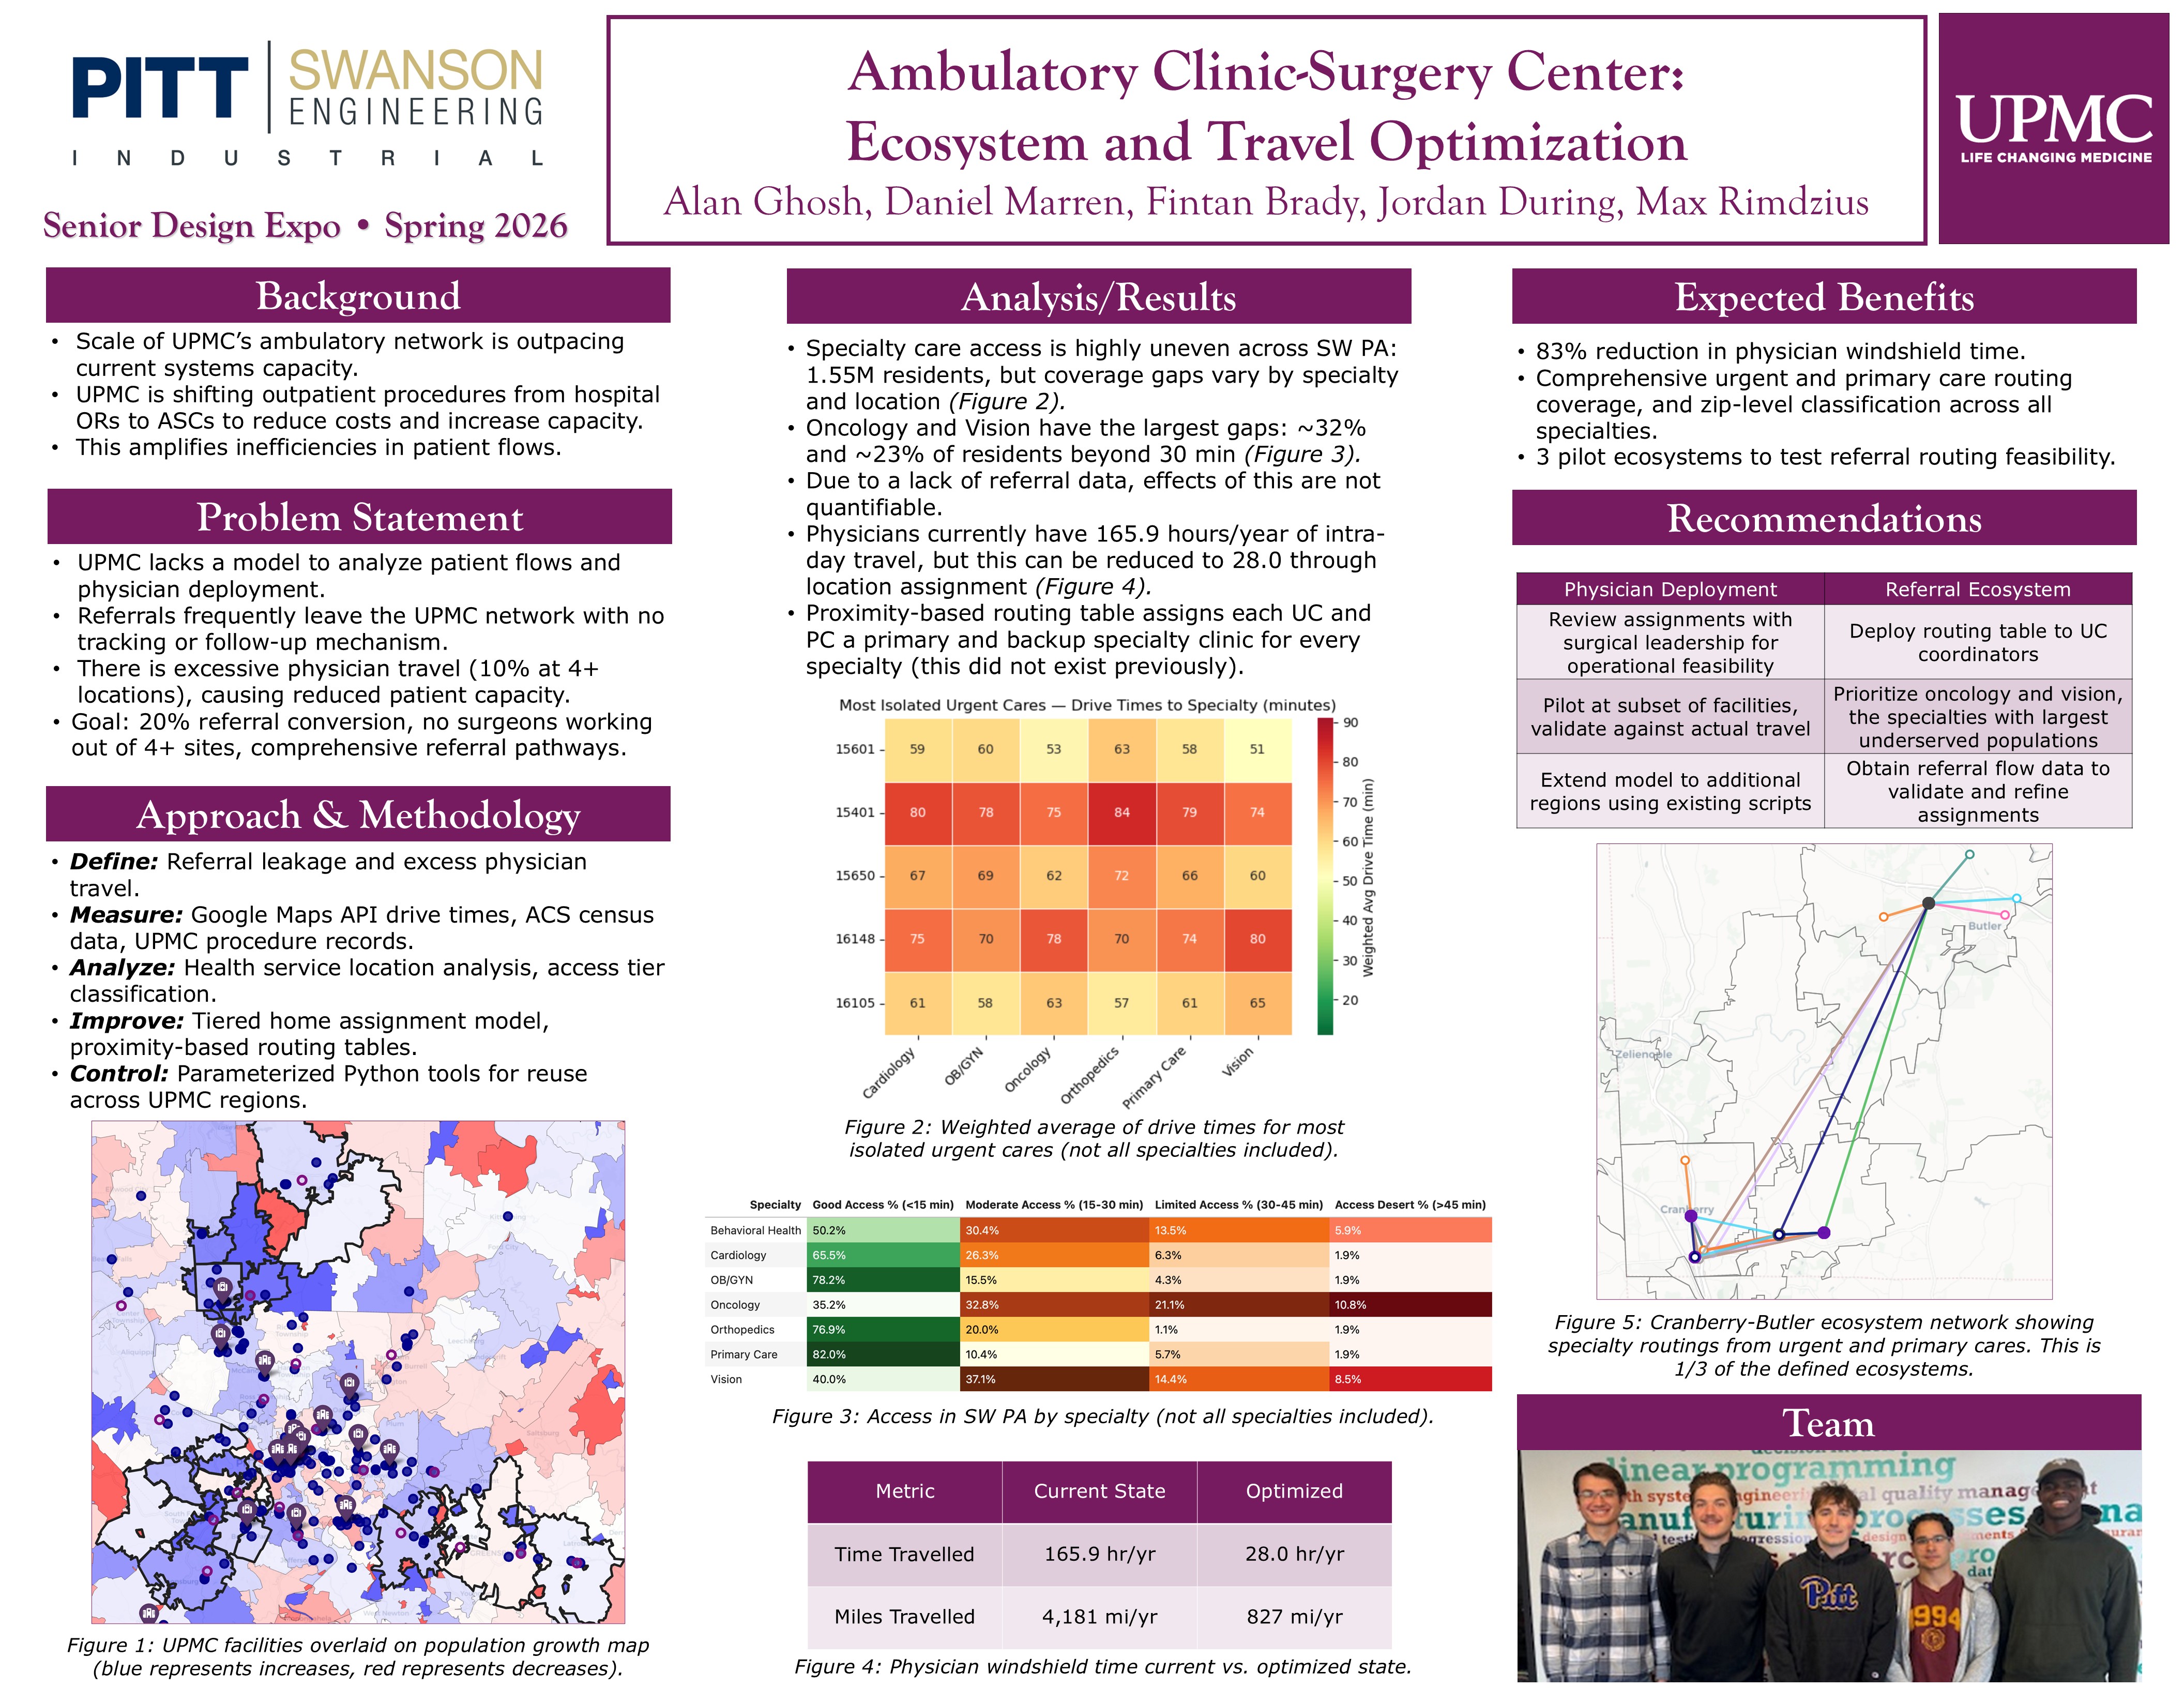
This project focuses on two main areas within UPMC’s ambulatory care network: how physicians are currently being deployed and how referrals from urgent and primary care connect to specialty services. As UPMC continues shifting more outpatient care to ambulatory surgery centers (ASCs), patient flow is becoming a central priority for managing capacity, reducing costs, and improving the overall patient experience. The goal of this project was to create practical, scalable tools that could help assign physicians more efficiently and make the referral process more structured across Southwestern Pennsylvania.
The team utilized the Lean Six Sigma DMAIC (Define, Measure, Analyze, Improve, Control) framework to guide the project. In the Define phase, project objectives were established with UPMC stakeholders, with the main focus on reducing physician travel time and improving referral retention. In the Measure phase, a year of surgical data, monthly visit data by specialty, Census data, and location data using the Google Maps Distance Matrix API were gathered to understand current performance. During the Analyze phase, several key issues were identified, including long travel times for some physicians and gaps in access to certain specialties, especially in suburban areas.
In the Improve phase, a tiered model was created that assigns physicians to a main hospital, ASC, and office based on case volume and distance. A standardized referral system was also developed, assigning each urgent care and primary care location a primary and backup specialty clinic based on drive time. The results show substantial improvements, with the physician deployment model reducing windshield time from 165.9 hours to 28.0 hours annually. This represents an 83% reduction in modeled windshield time, with annual miles traveled dropping from 4,181 to 827 and CO₂ emissions reduced from 1.67 to 0.33 metric tons. The referral routing framework established the first standard for directing patients to specialty care, addressing access gaps and reducing barriers to follow-up treatment. Additionally, routing assignments were applied within three pilot ecosystems: Cranberry-Butler (north of Pittsburgh), Southwest Allegheny County, and Irwin-Latrobe (east of Pittsburgh). These three regions encompass more than 60 ZIP codes and approximately 10,800 referrals, and they give UPMC regional templates to implement referral changes before incorporating them into the broader network.
Final deliverables include Python-based tools for both physician assignment and referral routing, along with maps, visualizations, and routing tables to support the analysis. These tools are designed so UPMC can reuse them and apply them to other regions if needed. Overall, the project provides a more structured, data-backed way to improve efficiency, keep more patients within the network, and support continued growth in the ambulatory care system.

This project redesigned the emergency code cart system in UPMC Presbyterian’s Cardiothoracic Intensive Care Unit (CTICU) to improve efficiency during high-risk procedures such as ECMO initiation and open chest events. The existing system relied on two separate carts with overlapping inventory, inconsistent organization, and limited visual standardization, resulting in inefficient retrieval under high cognitive load.
Baseline study results showed an average retrieval time of 17 seconds per item, 1.95 drawers opened per retrieval, and a 16.2% incorrect retrieval rate. To address these inefficiencies, the team applied Industrial Engineering principles using a DMADV framework to design an integrated, workflow-based cart system. Survey feedback further indicated variability in user familiarity, low confidence during emergencies, and reported delays due to missing or difficult-to-locate supplies. To address these inefficiencies, the team applied Industrial Engineering principles using a DMADV framework to design an integrated, workflow-based cart system.
This project addresses these challenges through the application of Industrial Engineering principles to develop a consolidated, standardized emergency cart system. The proposed solution integrates the existing ECMO and Open Chest carts into a single, workflow-based design that emphasizes intuitive layout, demandbased zoning, and visual management. Key design features include procedure-specific drawer organization, high-contrast labeling, shadow outlining, and ergonomic placement of high-frequency and high-weight items.
Overall, this project delivers a system-level redesign that enhances material accessibility, reduces cognitive load, and supports more efficient and reliable emergency response in the CTICU. The proposed solution aligns with clinical workflows, human factors principles, and operational constraints, providing a scalable and sustainable improvement to critical care infrastructure. The final solution consolidated both carts into a single system organized by clinical workflow, supported by visual management techniques including high-contrast labeling, color coding, and standardized item placement. A full-scale prototype was constructed and tested with CTICU nurses.
Post-design validation demonstrated improvements in retrieval time, reduction in nonproductive drawer openings, and a 71% reduction in incorrect item retrievals, with two of three performance metrics achieving statistical significance. Ergonomic analysis using 3DSSPP confirmed safe usability across all user groups.
The proposed system is estimated at $3,450 per cart and provides a scalable, implementable solution for the new UPMC tower. This redesign improves efficiency, reduces cognitive load, and supports more reliable emergency response.

The oncology care at the University of Pittsburgh Medical Center (UPMC) Shadyside and Hillman Cancer Center is expecting an increase in physician growth and patient demand. Currently, cancer patients are unable to get treatment due to high wait times, poor room utilization, and crowded hallways. It is critical that patients receive more efficient care to increase the maximum number of treatments that can be distributed daily.
To solve this problem, the student team used a structured DMAIC methodology to develop data-driven forecasting and capacity analysis models. For inpatient services, a regression forecasting model was created to estimate future patient demand using historical data and time-based variables. This model enhances accuracy and provides workers with the opportunity to predict demand and analyze capacity.
Instead of forecasting patient demand, the outpatient models were built to assess existing utilization. The treatment rooms model displays usage by day of the week and time of day, indicating periods of low and high utilization. While the exam rooms model shows a higher-level perspective, displaying utilization by individual room and time of day, which makes it possible to identify inefficiencies connected to physician scheduling.
The inpatient model shows that it is expected that Team A and Team B will be overutilized, so the team recommends either reallocating patients to other units or increasing the number of physicians. Outpatient limitations are more impacted by scheduling rather than physical space. Treatment rooms indicate low utilization in early mornings, late afternoons, and Fridays. Tracking surgical schedules for exam rooms and having a database that aligns both the physician and surgical appointments will help optimize scheduling across the board.
UPMC can use these tools to find capacity “trigger points” while continuously making operational improvements. By putting these recommendations into place, patient throughput will rise, wait times will reduce, and overall efficiency will improve with just the implementation of the models.

This project addresses a throughput challenge at CAES Honeywell’s cleanroom facility within its aerospace operations in Woburn, MA. The team was engaged by project sponsors Christopher Sommers and Brandon Smith to evaluate the current system and identify opportunities to increase production capacity. At present, the facility produces 12 units per month, which falls short of the current customer demand of 15 units per month. Demand is also projected to rise to 20 units per month in the near future, further emphasizing the need for operational improvements.
To assess the issue, the team conducted interviews with key stakeholders and performed a comprehensive root cause analysis. Analytical tools including a Relationship (REL) Chart and a From-To Chart were developed to evaluate interdepartmental flow and quantify material movement. Additional data was gathered from process engineer Jack Lam, including a routing sheet for part MD-012K136, which provided detailed insight into machine locations, department sizes, and product flow within the cleanroom. Using this information, the team created a spaghetti diagram that revealed inefficiencies in the current layout. Flow metrics were calculated using k-values, allowing the team to estimate the material handling costs associated with the existing configuration.
Based on these findings, the team designed an improved cleanroom layout using the Spiral method to enhance throughput and operational efficiency. A comparative analysis between the current and proposed layouts demonstrated reduced material handling costs and improved flow efficiency. To support long-term usability, the team also developed an Interactive Layout Tool to assist facility personnel in evaluating and modifying layouts without requiring extensive technical expertise.
Finally, the team outlined an implementation plan and provided key recommendations to guide future improvements. These include adopting the proposed layout, removing nonoperational equipment, increasing automation, cross-training employees, and reducing lead times. Collectively, these changes are expected to enable the Woburn facility to meet both current and projected customer demand.