
(Last updated: December 2021)
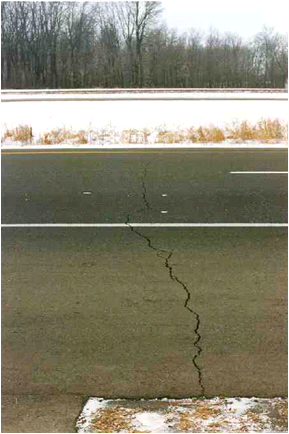
Fig.4 Transverse Cracking
a) Transverse cracking in an existing HMA pavement (non-deteriorated)

(MnROAD, 1997)
b) Transverse cracking in an existing HMA pavement (deteriorated)
(http://www.pavementinteractive.org/article/transverse-cracking/)
Fig. 3: Examples of fatigue cracking in HMA pavement
Description
Fatigue cracking is found in areas subjected to repeated traffic loadings (wheelpaths). It can appear as a series of interconnected cracks in the early stages of development. It ultimately develops into man-sided, sharp-angled pieces, characteristically with an alligator pattern, in later stages. (Distress Identification Manual for the LTPP, FHWA, 2003
Severity Levels
(a) Adequate
Wheelpath cracking has only a few connecting cracks; cracks are not spalled or sealed; pumping is not evident.

(http://www.pavementinteractive.org/wp-content/uploads/2008/08/WSDOT062.jpg)
(b) Marginal Wheelpath cracks are interconnected and form a complete pattern; cracks may be slightly spalled or sealed; pumping is not evident.
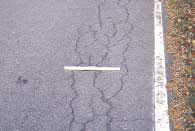
(Distress Identification Manual for the LTPP. FHWA, 2003)
Fiber Guide
BCOA-ME incorporates the effect of fibers in the development of fatigue cracks through the addition of a residual strength to the Modulus of Rupture (MOR), following the approach recommended by the Illinois Center for Transportation (Roesler, et al. (2008), Report No. FHWA-ICT-08-016). This is expressed in terms of a stress factor, which is the ratio of the total enhanced MOR to the MOR without fibers. For a given fiber content, the Interpolated Stress Factor (ISF) is evaluated as shown in Equation 45 in the Theory Manual, and then used to compute the enhanced MOR. The user can specify the fiber content for the fiber types shown below, and the residual strength (f150) is calculated automatically by the program based on the corresponding parameters. The residual strength calculated is provided along with the design results. However, it is recommended that the evaluated residual strength be verified by experimental testing as per ASTM C1609.
| Type | Specific Gravity | Absolute Volume Faction | Stress Factor | ||
| Minimum | Maximum | Minimum | Maximum | ||
| Synthetic Structural Fibers | 0.92 | 0.194 | 0.477 | 1.24 | 1.39 |
The tool also allows the user to directly specify the residual strength for a user-defined fiber type. This can be evaluated using the “Residual Strength Estimator Spreadsheet” provided here. This user-specified residual strength is automatically added to the specified strength of the concrete (under "PCC Overlay Properties") by the tool. Currently, fibers are not considered in the faulting evaluation.
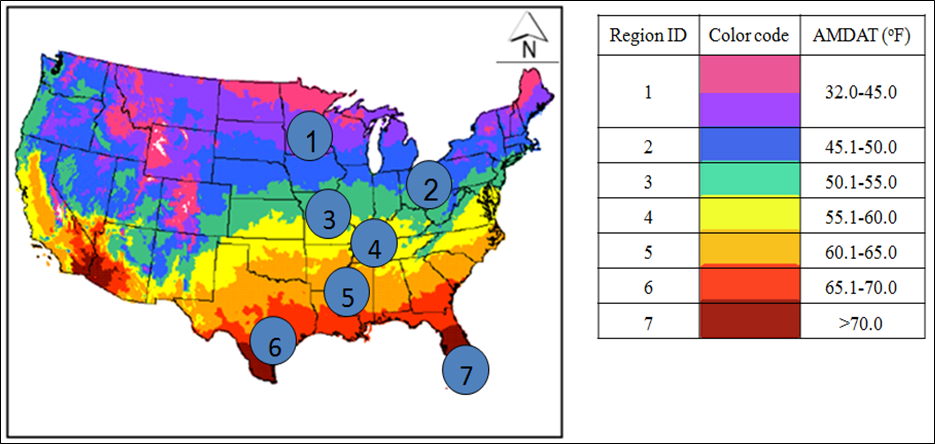
AMDAT Region ID
Fig. 1: Annual mean daily average temperature (AMDAT) map of USA.
Map of Sunshine Zone
Fig. 2: Annual concentrating solar resource map of USA.
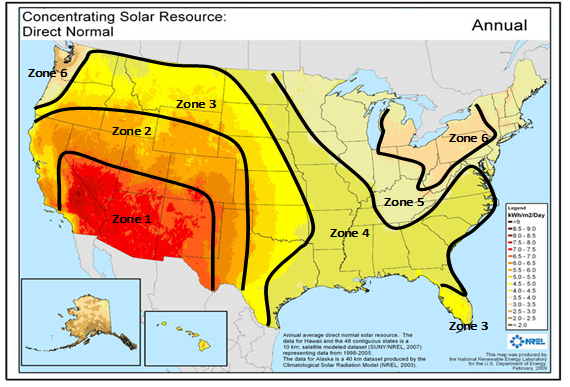
Note: The appropreate zone must be selected from the drop-down box on the Design Sheet.
CTE Estimator
Recommended Value of the Thermal Coef. of PCC as a Function of Agg. Types
| Type of Coarse Aggregate | Concrete Thermal Coef. (10e-6/°F) |
|---|---|
| Quartz | 6.6 |
| Sandstone | 6.5 |
| Gravel | 6 |
| Granite | 5.3 |
| Basalt | 4.8 |
| Limestone | 3.8 |
(AASHTO 93, pp II-29)